


Cooper TabStand Height Adjustable Tablet & Portable Monitor Stand for Desk
$39.95
-
Frost White
-
Night Black


Cooper MagStand Adjustable Magnetic iPhone Stand for Desk (MagSafe Compatible)
from $24.95
-
Night Black
-
Cream White


Cooper ChatStand Cell Phone Stand for Desk with Height Adjustable, Rotating Holder
from $23.95
-
Night Black
-
Frost White
-
Metallic Gray
-
Pink Rose Gold


Bam Bino Space Suit Super Rugged Kids case with Screen Guard for iPad 11-inch (A16) - 2025
$24.95
-
Galactic Blue
-
Cosmic Black
-
Watermelon Pink
-
Mint Green
- + 1


-25%


T2C Infographics: 2012 The Tablet Takeover
2012 The Tablet Takeover is the 3rd infographic in a series of monthly visual presentations of knowledge by Tablet2Cases.com.
This infographic looks at how we use tablets on a daily basis including content consumption, shopping habits, peak usage times and correlation between tablet size and pageviews. All the information is based on data provided by IPSOS, Journalism.org & Comscore.
Click the image below for larger view.

Sources:
- New Study Shows that Owners of Both a Smartphone and a Tablet Spend More Time and Money on Mobile Shopping
- How People Use Tablets and What it Means for the Future of News
- Tablet Competition Heats Up: Kindle Fire Captures more than Half of Android Tablet Market
- Digital Omnivores: How Tablets, Smartphones and Connected Devices are Changing U.S. Digital Media Consumption Habits


Pure Sense Buddy Antibacterial Rugged tablet case for Apple iPad Pro 11
- Pink
The Buddy is a tablet case that repels bacteria and protects your iPad. It's a special case that contains an antimicrobial agent (provided by SteriTouch) to controls organisms responsible for smell, odours, and staining. It does all of that while...
$29.95
-
Blue
-
Pink


Sold Out
from $29.95
-
Morocco Blue
-
Black
-
Tan
-
Olive
- + 1
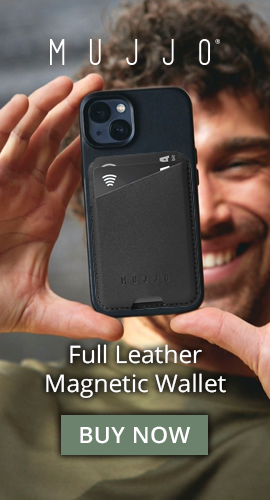
Mujjo Full Leather Wallet case for Apple iPhone Xs, iPhone X
- Morocco Blue
Mujjo's best leather wallet case yet, handcrafted for Apple iPhone Xs and iPhone X. Completely redesigned leather wallet cover using a new in-mold production process that improves product quality for everyday use. All-in-one integrated card pocket holds 2-3 cards. Full...
from $29.95
-
Morocco Blue
-
Black
-
Tan
-
Olive
- + 1


from $17.95
-
Apple Green
-
Candy Blue
-
Bubble Gum Pink
-
Licorice Black
- + 1
Cooper Dynamo Rugged Kids Play Case for Apple iPad Air (5th-4th-3rd-2nd-1st Gen)
- Candy Blue
A Cooper Cases original, the Dynamo has a comforting foam casing that acts as a barrier between your child’s wild exploration and you have heart attack.Originally launched in 2012, it’s great for all ages. Your 2-year-old can use it as...
from $17.95
-
Apple Green
-
Candy Blue
-
Bubble Gum Pink
-
Licorice Black
- + 1


Sold Out
$49.95
-
Silver
Cooper Kai Skel P1 Keyboard Clamshell with built-in Power Bank for Apple iPad 4 3 2
- Silver
What if we told you, you could transform your iPad into a bona fide Macbook Pro? Well, the Clamshell will do just that, it's about as close as you can get to upgrade your iPad to a laptop these days....
$49.95
-
Silver


Sold Out
Mujjo Full Leather case for Apple iPhone 13 Pro
- Blue
Keeping things simple Mujjo is an acclaimed Dutch designer label. A pioneer in accessible luxury leather accessories for Apple and Samsung products. Mujjo created the world's first leather wallet case for iPhone (way before Apple introduced it). Mujjo also developed...
$44.95
-
Blue
-
Black
-
Tan


from $12.95
-
Black
-
Blue
-
Pink
Cooper Bounce Strap Drop Proof Rugged Case w/ Shoulder Strap, Hand Strap & Kickstand For Apple iPad / Samsung
- Black
Cooper Bounce Strap Drop Proof Rugged Case With Shoulder Strap For Your iPad. One case to rule them all? This case is made of 100% non-toxic, easy to wash silicon that can be easily removed to clean. It comes in...
from $12.95
-
Black
-
Blue
-
Pink


Sold Out
$39.95
-
Black
-
Blue
-
Purple
-
Rose Gold
Cooper Backlight Executive Universal Bluetooth Keyboard Folio for 9-10.5" Tablets (with Backlit keys)
- Black
The latest tech weapon of the mobile executive is a refined, reliable, and dashing black PU leather case and keyboard combo. Digital nomads and compulsive overachievers will delight in the magnetically detachable, backlit keyboard for those long and often dim...
$39.95
-
Black
-
Blue
-
Purple
-
Rose Gold


Cooper Magic Carry II PRO Shoulder Strap Folio for Apple iPad
What you win in screen size and performance with tablets you tend to lose in mobility. As soon as you have to carry your tablet from A to B and do anything in between you'll experience the frustration. You can't...
from $0.00